Data is integral to decision making. Being able to see where resources are allocated or compare requested allocations against capacity is vital for resource capacity planning and future forecasting.
Yet, most PPM systems’ in-product reporting tools are complex, inefficient, and difficult to use.
One option is to tack on an enterprise resource reporting tool, which usually requires bringing in a data scientist just to extract the reports you need. However, when using services like these, one must factor in their high rates and turnaround time.
Another option is to use Excel for resource reporting. The challenge with Excel, though, becomes how many pivotcharts and new excel tabs you need to set up just to generate any kind of meaningful report. By the time the Excel report is ready, data may already be stale.
At Tempus Resource, we believe this is too many hoops to jump through when all you want to do is get your own data out of your system.
That’s why we built Tempus with a complete resource reporting system integrated right into the app. Reports are entirely customizable, offer a variety of co-author or filtering options, and have no limit to how many times they can be run.
With Tempus, you have the ability to create comprehensive resource management reports reports that deliver more insight than ever, all within one system.
TEMPUS REPORTING FEATURES
Tempus Resource’s reporting tool not only provides unparalleled reporting capabilities, but also utilizes a completely user-friendly interface. If you can drag and drop, you can build advanced, engaging reports within Tempus.
And once you’ve created a resource management report, it is immediately available to you with live data. Run it as many times as you want; there is absolutely no limit.
You can run reports from your live data, or you can run resource reports using What-If scenarios you’ve created within Tempus. This feature is incredibly powerful for analyzing whether your organization should implement proposed changes, large or small, and what obstacles will need to be addressed to ensure a smooth transition.
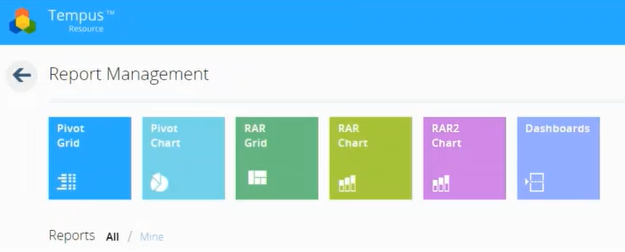
TEMPUS REPORT WRITERS
Tempus features five report writers: Pivot Grid, Pivot Chart, RAR (Resource Allocation Reports) Grid, RAR Chart, and RAR2 Chart. There is also a dashboard designer to aggregate your data. These report writers allow you the flexibility to design the report that will be most valuable to you.
Within each report writer, there is a 3-tab configurator to set up the report, each with slight variances for the specific type of report writer.
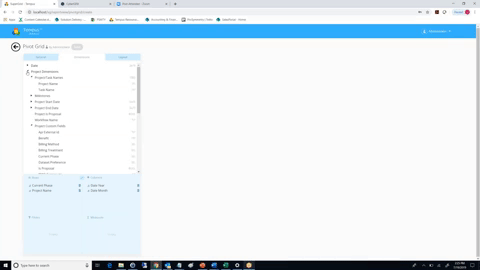
For example, the 3 tabs within the Pivot Grid report writer will prompt you to input the general information, select your dimensions, and then choose your layout.
The general information will include the name of your project, a description, and what data you’d like to use as your source. Again, you can choose between your live data or any of your saved What-If models.
The dimensions tabs allow you to explore all of the data in the system. Everything from standard date fields to your custom fields—such as attributes, project resources, and assignments—automatically appears on the form, so there’s no need to reconfigure a reporting module just to access the data you need. As a result, performing a search is much easier.
Below the dimensions is a table with four sections labeled Rows, Columns, Filters, and Measures. To build your report, you will simply drag and drop the dimensions you need into the corresponding section.
As you add dimensions, your report will auto-generate within the same screen. This allows you to quickly see if the report is showing you the data you need or if there are more filters and measurements that you need to include. Keep in mind, the requirements you set for your report are entirely customizable, so you can get the latest information needed to create an accurate resources report.
Once the report is built, you can access it anytime within Tempus or export to Excel, CSV, or PDF. Parameter-based filtering also enables you to create one report that can be shared with various departments. Instead of every department taking the time to build almost identical reports, you can share one report that each department will be able to run and filter by their own department and resources. This allows companies to skip the hassle of double-work, which provides a more efficient work environment for all involved.
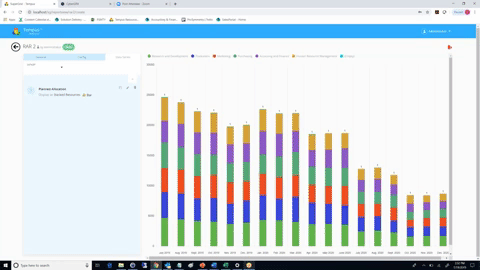
RAR2 CHART
There is one report in particular that all organizations find extremely valuable. Whether you refer to it as a stacked bar chart, mountain chart, area chart, or shale chart, the chart in question is one that shows requested allocations against headcount or capacity.
The Tempus Resource Allocation Report 2 Chart, or RAR2 Chart, report writer allows you to access this powerful information in a few simple steps.
Under the Configuration tab, you can specify time granularity by year, quarter, month, week, or day as well as choose whether to measure your resources in hours, cost, or FTE. Under the Data Series tab, select from different data sets in the system such as Allocation, Demand, Net Availability Allocation, and many more.
Next, you’ll specify if the data type you want to see is planned, actual, or remaining. The “Display As” options allow you to view the data as a bar chart, line chart, or area chart with multiple layouts and color coding options.
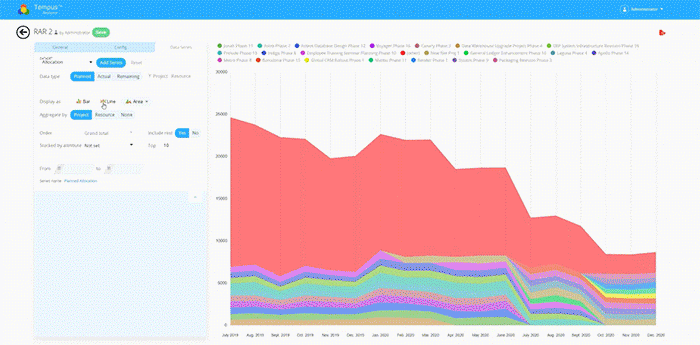
Choose to aggregate the data by project, resource, or none. You can also stack the data by project attributes such as customer, region, associated program, or what’s in each phase. Layer in data sets, view your capacity line, add series, and even compare actuals to future forecasts.
The possibilities for pulling and reviewing your data are infinite. But thanks to the intuitive layout and drag-and-drop interface, building a report is incredibly simple. Never again will you need to rely on a third party just to review your own data.
OTHER REPORTING FEATURES
Outside of the reporting tool, you’ll find reporting features built into many elements of Tempus.
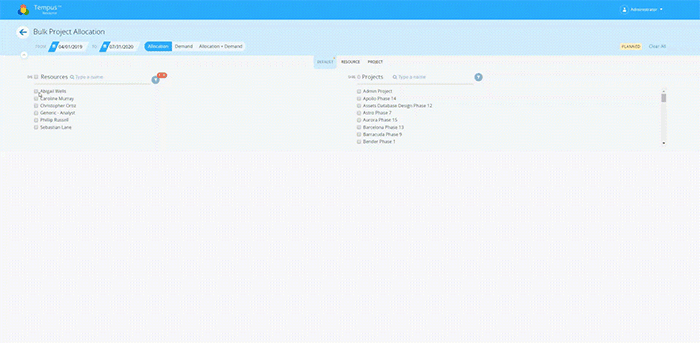
With Bulk Project Allocation (or BPA), you’ll be able to access a global account of everywhere your resources are allocated by simply selecting their name. BPA will provide a roll up as well as a configurable heat map that is color-coded based on allocation levels.
This insight into how your resources are currently allocated enables you to make decisions in real time based on accurate data.
Tempus’s What-If Forecasting also delivers powerful insight into your data. This tool allows you to test hypothetical scenarios to see their potential impact on timeline, budget, and resource allocation on both current and future projects.
Each element of Tempus was designed to help resource managers maximize resources, strengthen their strategic decision making capabilities, and unlock strategic value.
THE VALUE OF DATA
Fundamentally, data reporting is how you analyze your supply and demand. Identifying where you may be over or under-utilized can help your organization become more efficient and avoid missing milestones.
Reports can also play a major role in communication with leadership. Being able to share accurate and real-time data with leadership enables resource managers to expound on a project’s current status and what will be required for successful delivery.
But this insight is only valuable if it can be obtained and analyzed efficiently.
You shouldn’t need a data scientist to pull the data you need to make informed decisions.
Rather, you should be able to make decisions about resource capacity planning and future forecasting with real-time data the moment you need it.
With completely customizable reports that are intuitive to create and run, Tempus’s reporting tool provides unparalleled reporting capabilities for more insight than ever. Please contact us if you have any further questions about resource reporting.